Launch of California School Dashboard
Author: Rick Phelan
Published: 02.05.17
 A new electronic tool called the California School Dashboard is being viewed by educators, parents and communities across the state. The 'dashboard' aims to provide metrics that will help parents, educators, and the public evaluate schools and districts, identify strengths and weaknesses, and provide targeted assistance. Indicators on the California School Dashboard are based on elements of California’s new K-12 school accountability system.
The California State Board of Education adopted new accountability measures in Fall 2016. Metrics are based on Local Control Funding Formula (LCFF) priorities such as: parent engagement, school climate, student achievement, English learner progress, and graduation rates. The California School Dashboard being rolled out this month will have data in these areas, along with others for all K-12 public schools.
Different from previous school metrics such as the Academic Performance Index (API) and Adequate Yearly Progress (AYP) that were intended to sanction and punish schools, the focus of these new metrics is to support continuous improvement. State Board of Education President Michael Kirst, says the California School Dashboard embodies key shifts in thinking about state public schools. Three of these shifts are:
- School Measures: A quality education is defined by more than a single test score. The dashboard offers different measures that can help a district build on strengths and improve areas of low performance.
- Equity: California seeks to provide quality education for all students. The dashboard supports developing district capacity to address disparities among student groups.
- Local Decision Making: Districts understand student needs and are accountable to their communities. The dashboard will help promote transparency about district work, and encourage involvement among community stakeholders.
The California School Dashboard shows district and school performance on six state performance indicators and four local indicators.
State Indicators
The state indicators are based on data that is collected consistently across the state through the California Longitudinal Pupil Achievement Data System (CALPADS). The state indicators by LCFF priority area are:
- Academic Indicator (English Language Arts and Math)- Priority 4
- English Learner Progress- Priority 4
- Chronic Absenteeism- Priority 5
- Graduation Rates- Priority 5
- Suspension Rate- Priority 6
- College/Career Readiness- Priorities 7 & 8
Data is gathered and performance levels are calculated for each of the state indicators. These calculations are made using percentiles in 5 by 5 reference charts that combine Status and Change. Status represents the most current data on a state indicator. Change compares current year results to previous year(s) results. An example of a 5 by 5 reference chart for high school graduation is shown below.
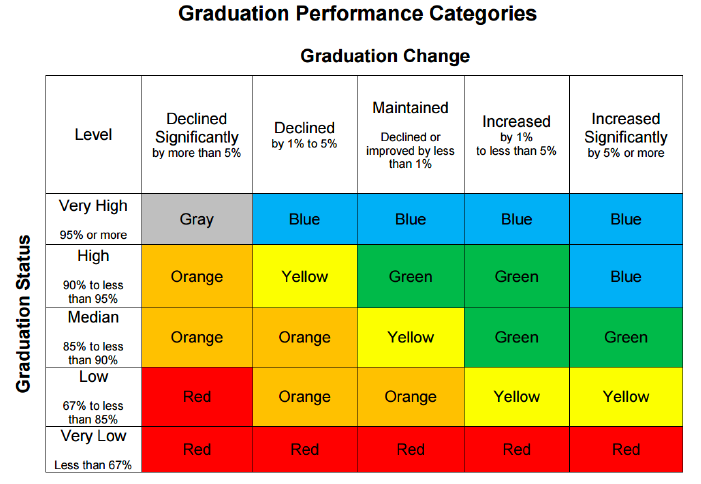
Using high school graduation, five status levels are set, with a low of a graduation rate of less than 67 percent (considered very poor) to a high of a 95 percent graduation rate (considered very high). In addition, five rates of change were set, from a low of a decline of 5 percent or more to a high of an increase of 5 percent or more.
With each of the state indicators, the California School Dashboard provides color and amount of fill diagrams (eg. green always has four segments filled, red always has only one segment filled) to express a district or school’s performance levels.

The Dashboard shows performance levels using the images above for all significant subgroups including: economically disadvantaged students, ethnic subgroups, special education students, and foster youth. Significant subgroups are defined as groups of 30 or more students. Status and change reports are presented for groups of 11 to 29 students. An * indicates that there are less than 10 students in a specific subgroup. An N/A is displayed in cases where no data has been provided.
Local Indicators
Data is not collected at the state level for some LCFF priorities. Within these areas, Local Education Agencies have setup metrics and gather information that is reported in their Local Control Accountability Plans. Know as 'Local Indicators,' districts will have the ability to add information in this area to their Dashboard data set. The local indicators include:
- Basic Services- Priority 1
- Implementation of State Academic Standards- Priority 2
- Parent Engagement- Priority 3
- School Climate- Priority 6
Indicators for local data will involve the descriptors of Met, Not Met, and Not Met for Two or More Years.
District Dashboard Coordinators will collaborate with colleagues to gather local indicator information and load it into the appropriate section of their dashboard. Note that local indicators are reported for a district only and are not expressed for individual schools.
Dashboard Interface
The home data screen for the California School Dashboard is shown below.

Users are able to choose from four different reports by selecting tabs underneath a district’s information.

Detailed information on what’s available from each of the four tabs is provided here:
- Equity Report- provides options to show State and Local Indicators. The State Indicators show the performance level for all students in a district. It also presents the total number of students large enough to receive a performance level with State Indicators from the various subgroups. Orange and Red performance levels are shown to display subgroups that are struggling with the State Indicators.
- Status and Change Report- shows the performance level for each State Indicator and the current performance (Status) and difference from past performance (Change) that resulted in that performance.
- Detailed Reports- displays year by year data for the State Indicators and additional state data that is relevant to the indicators. Users will see data in at least three groups: 1) academic performance, 2) academic engagement, and 3) school conditions & climate. The aim here is to reinforce the relationships among the indicators and to make the information more digestible.
- Student Group Report- shows the performance of all students and each subgroup on the State Indicators. Users can filter reports to highlight only groups in: a. Blue & Green Performance Levels, b. Yellow Performance Level, or c. Orange & Red Performance Levels. Users can also quickly display information on one specific State Indicator with all student subgroups displayed. Finally a specific subgroup can be selected and all State Indicators can be seen.
Timeline for California School Dashboard Release
|
Dates
|
Access Group
|
|
February 2017
|
Embargoed access to LEA Superintendents & Dashboard Coordinators
|
|
March 2017
|
Public Launch
|
California State Board of Education President Michael Kirst sums up work with the California School Dashboard saying, “...this completes the final pieces of a groundbreaking system to help the public better understand what is going on in our schools.”
Link to the California School Dashboard
Related Information
California's New Accountability System Taking Shape
California School Dashboard News Release from the California Department of Education
Blog: Technology for Learners